In this article, we will talk about process management in any IT operation, we will start by defining what process and managing them means, what commands can help us achieve this, and common pitfalls.
My lab is running on a Centos 9 Stream, which came out this very month. Most of this will apply to Linux distribution, I will not cover Unix or Windows command.
Definition
A process is any active (i.e. running) instance of a program. A program is a sequence of instructions understandable by the CPU. It can be a ready-to-run program like an executable file.
Process management will handle this process life cycle. From the time a process is born to when It is terminated, It can be runnable, running, sleeping (in memory or on disk) and zombie states.
Process lifecycle
Init
All processes are descendants of the init process, whose PID is one.
You can check this init process existence with: 
Each process has a parent, and a list of children and sibling.
When creating a new process, they can either be spawned from fork() or exec(). Difference is fork is an almost full duplication of the original process (new PID, etc.) while exec replaces the original process.
For more informations, check out copy-on-write for fork optimization.
Running state
It is when It will start to use the most precious resource in the system: the CPU. But the CPU can not answer to all process at the same time, It has a limited pool. That’s when the scheduler comes in to sort it through.
After being created, your process will wait until the CPU scheduler decides to let him run (i.e. execute his set of tasks).
These states are :
- Running or runnable (R) - where process waits for the scheduler dispatch
- Uninterruptible sleep (D) - does not react to any signals and waits for the resources
- Interruptable Sleep (S) - will react to signals and the availability of resources
Stopped state
After your process is done with his set of tasks, It will naturally try to run the exit system call, which will releases its data structure and send a SIGCHLD signal to its parent process.
The child process will stay in a ZOMBIE state until the parent use wait() system call to reap zombies.
If the parent died in-between this, the child will re-attach to its grandparents, up until init process. At this point, init will periodically executes the wait system call to reap any zombies in its direct descendant.
Bonus It’s possible to know at any given time the number of process by states and user: 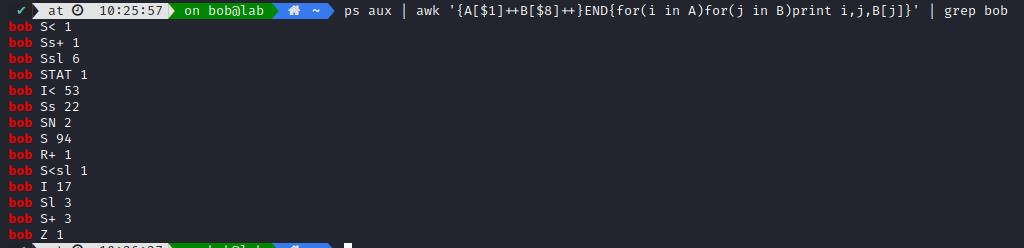
As you can notice, there is a lot of sleeping processes. You can also check out what are those substates, like Ss+ or Ssl.
Helpful commands
Checking process state
Process are the bread and butter of your operation, as they will always be the starting point of any resource comsumption. In an IT operation setting, we will have to monitor this number of process as It’s an interesting metric to have in your pocket.
Let’s say you had multiple system failures over a few weeks, where disk comsumption was hard to predict as It was bursty and in bulk. You check out the number of process spawned/killed over time and notices a trend, It appears that when the number of process goes beyond a certain point, there was a 50% chance to encounter a system failure. It did not solve your problem, but It got you an investigation starting point, and can help you predict ressources comsumption in the future. For example, you can set an alert on this treshold because you know a system failure can happen in this context.
There are multiple ways to check the state of a process in Linux.
Command-line tools
Two commands are mainly used to check out a process in Linux, they are named ps and top
ps means process snapshot, It will print you a report of the current processes. Be careful as snapshot/report always mean dealing with static data. It is nice to use if you want to get familiar with process management, but It is hardly used in production. It does not bring you context, and be falsely leading, as you are just playing roulette with the CPU scheduler.
For example, you could think a process is stuck in ZOMBIE state, but you were just seeing it in between its SIGCHLD and exit calls.
If you want to show a process tree: 
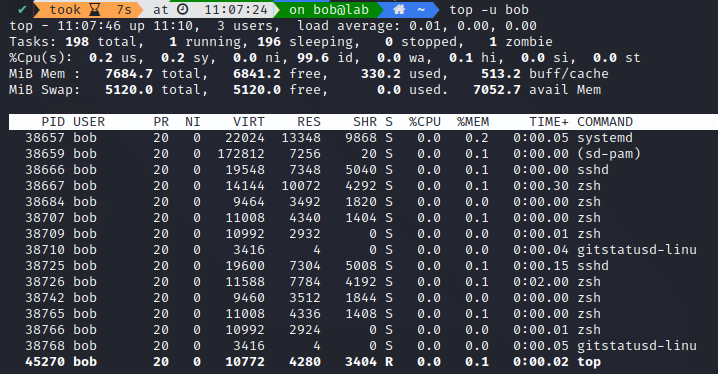
top is the same exact command as ps but It’s run periodically over time.
There is many alternatives, using Python or nodeJS, to top, like htop, atop, nmon, vtop, bashtop, gtop.
An example with bashtop: 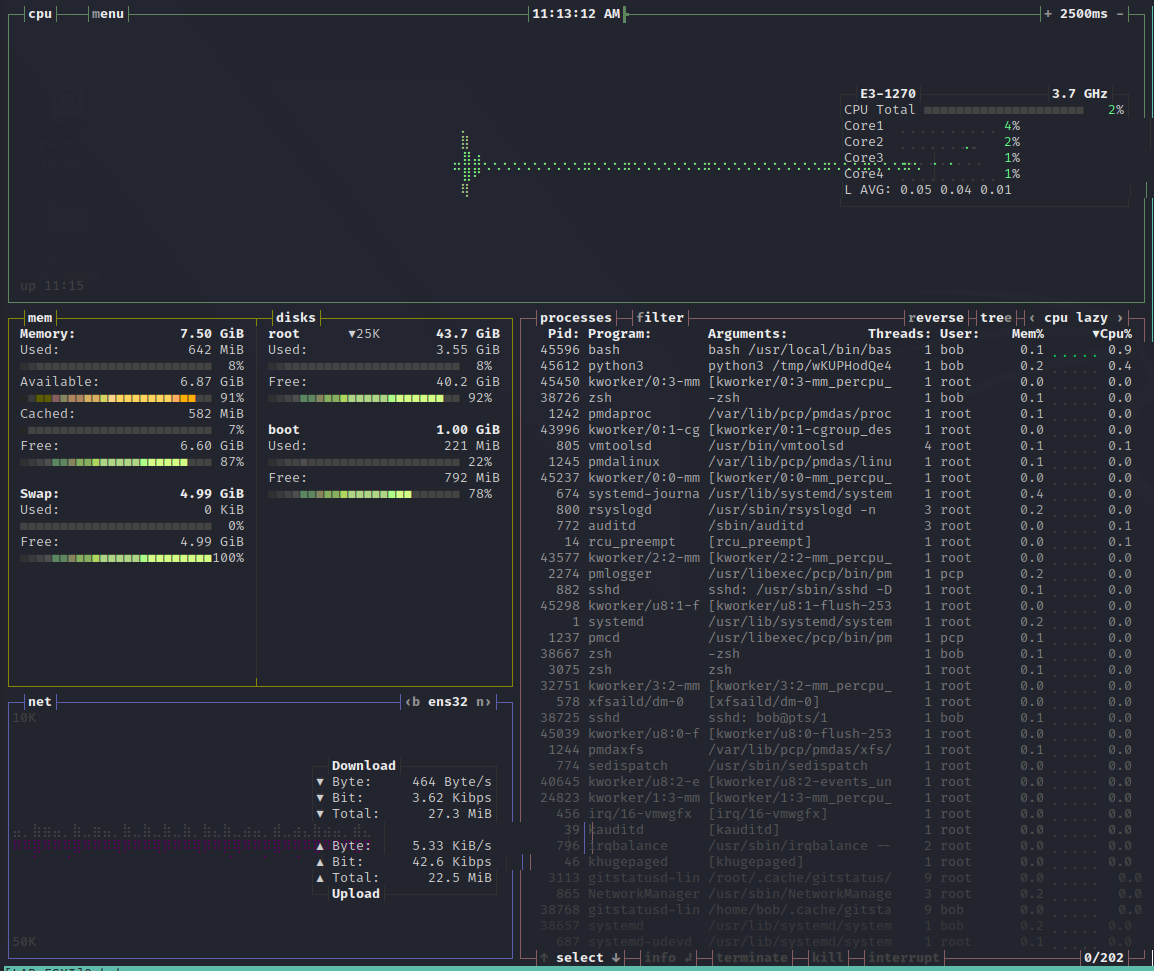
But as usual, It is only nice to get familiar with a specific system, but It is not helpful in the long run, or if you have to monitor hundreds of servers. Some of these alternatives also consumes a non-negligible amount of resources on the host as they pool informations from the entire system.
Pseudo status file
In Linux, everything is a file. It is also true for process, each time you spawn a new one with exec() or fork(), you create a new file, only available in memory, in the /proc/ filesystem.
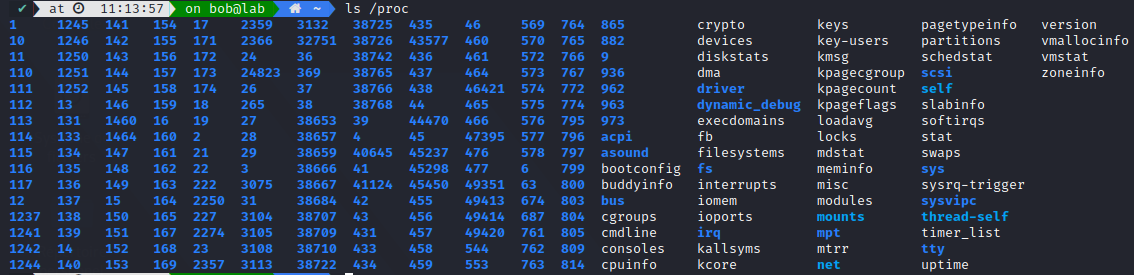
We can access our process state in this filesystem, along with other runtime informations on the system (like devices, diskstats, etc.)
It can regarded as a control and information centre for the kernel, and quite a lot of system utilities (think ps or top) are simply parsing through this filesystem. A few details to remember is:
- All file size in /proc are 0 - they are only pointers to the kernel memory space
- Each numbered directories corresponds to an actual process ID - /proc/{PID}/
You can know more about each file meaning here
This is the best place to gather metrics, as you can directly access the information you need without any unecessary calls. If you need to often poll your system health, Its best to avoid any overhead.
Process metrics
Now that we understand what a process is, and how It evolves, we can start to lean into the management side. Question is: How do we effectively manage a process ? What set of metrics can we use to monitor a system health ?
But first, what is a metric ? It’s a single, quantifiable type of data that is used for measurement and we use it to reach a measurable goal set by our project.
We are not expert, and this is definitely a research theme. The main issue is : how do we avoid overfitting our dataset ? We are not data scientist, but we need to be careful as to not introduce to much noise in our metrics, we only want to scrape the main indicators.
We will try to gather informations from the current best-practice. Let’s look at some of the most popular agent used to gather metrics from host:
For most commercials solutions, they do not tell you what metrics they scrape, as It is their main selling point (less metrics, better performance).
We can however see those main process metrics:
- Number of processes by user and name
- CPU and memory usage per process or binary name
Polled in /proc: - /{PID} - /net - /sys - /mdstat - /schedstat - /vmstat - /meminfo_numa - /self
In the case of datadog, they then can end up showing this type of visualization (% of CPU/log ratio): 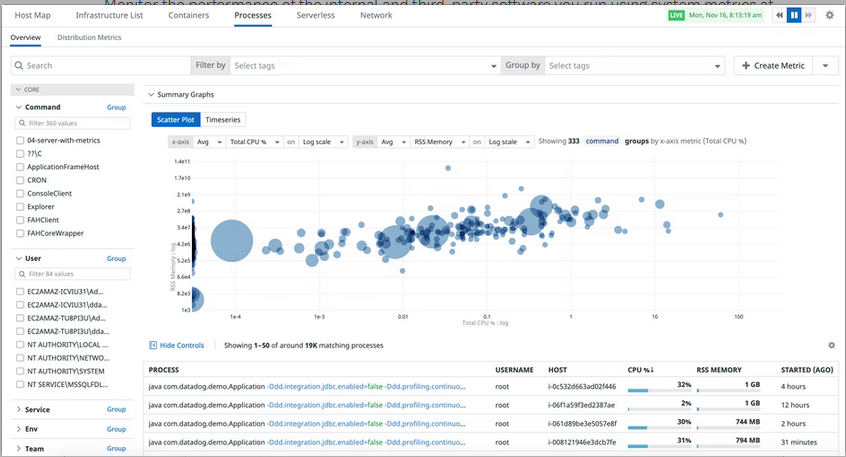
Note: There is a shifting focus on their containerization metrics, to be able to monitor those process metrics running inside a container.
Take it a step further
Check out ressources on distributed and containerized infrastructures, as they make this more complex.
You can also dive deeper into the subsystem of process management like signal handling, process/thread creation & termination and process scheduler.
Credits https://www.redhat.com/sysadmin/linux-command-basics-7-commands-process-management
https://www.baeldung.com/linux/top-command
https://www.baeldung.com/linux/process-states
https://www.kernel.org/doc/html/latest/filesystems/proc.html
https://sre.google/sre-book/